
Highlights §
- Just because you think an insight is actionable doesn’t mean action will be taken. You spend days cleaning the data, exploring it and finding some interesting or even insightful things to present. You deliver the insights in a beautiful presentation and recommend the best course of action. The executive team thanks you but they don’t follow through. (View Highlight)
- The most surprising truth about complex systems (like organizations) is that they are not a sum of their parts. Any attempt to improve them by improving all the parts independently will not result in meaningful improvements to the whole. (View Highlight)
- Organizations are non-deterministic systems. They are built from interdependent parts; sales doesn’t work without a product or without marketing. If you build a product without sales, you don’t have a business.
In fact the parts are so interconnected that a small change in one can lead to dramatic changes in others. It is paramount that all the parts of the system work together in concert in order to achieve the goal that the system was designed for (make more money now and in the future)
This means the organization can be thought of as a chain of links, each one doing its part to deliver the goal. Marketing feeds sales with qualified leads. Sales converts leads into customers through product features. Customer success team ensures customers have a smooth onboarding experience, to foster adoption, etc. (View Highlight)
- If all the links in the chain are working properly, the result is a smooth flow of Throughput (Revenue/Customers) through the system. If however there’s a problem (constraint) in any of the stages, either a technical issue, design issue or even staffing issue, the entire chain suffers, especially if the issue is closer to be start of the flow.
Consequently any changes in any areas that are NOT the constraint will result in minimal or no improvements overall.
So what is a constraint?
A constraint is a point of maximal leverage in a system, such that when solved unlocks massive incremental value for the entire system.
The Theory of Constraints (TOC) claims that there are very few constraints even in large systems. However this depends on the level of abstraction you’re considering. When you find a constraint for example in the Evaluation stage, you will have to zoom in to a deeper level of detail so you can find the issue. (View Highlight)
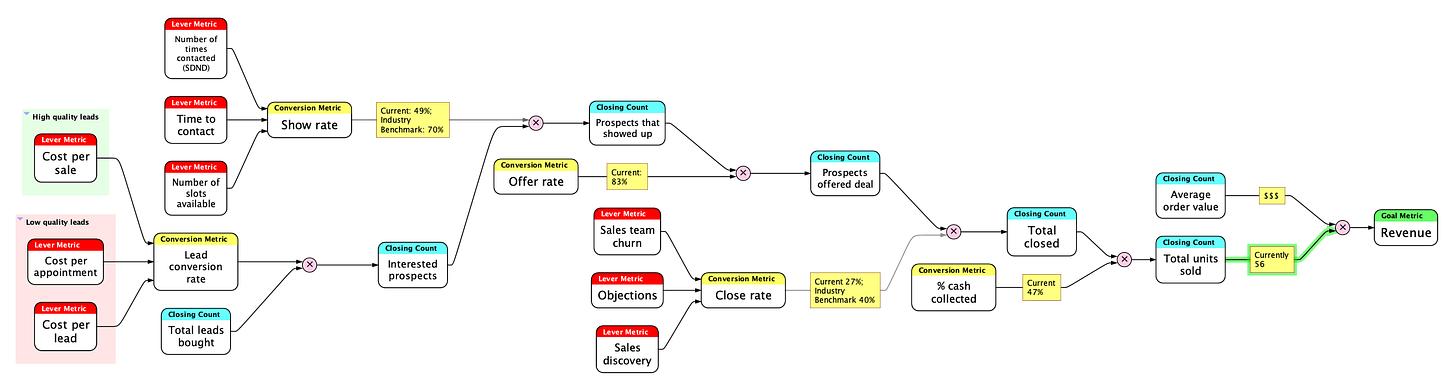
- In this example, Alex is working on a sales funnel. The value stream is made up of several stages:
Show Up => Make Offer => Close Sale => Revenue
Each of the stages is tracked through conversion rates (Show Rate, Offer Rate, Close Rate. Total Sold is the Goal Metric we ultimately want to drive. People might call this “North Star” metric but I personally hate that term.
Let’s see how Alex uses constraints to make a huge impact on the bottom line.
First he finds the constraints/leverage points:
• The show rate, which is the number of people who show up for a sales appointment over those who are registered is too low (49% when it should be 70%)
• The close rate, which is is the number of people who actually buy over those who are offered the deal is too low (27% when it should be 40%)
• Organizational structure issues
How did he find the constraints?
You’ll notice that he had a target/benchmark for each one and when compared to the target, the differences are massive.
Ok, but how did he find those targets?
Benchmarks/targets are one of two ways of discovering anomalies in key metrics. As Alex mentions in the video, he discovered those targets for that specific type of business via experimentation. Sometimes you can use industry standards here (e.g. email open rate)
The second way to discover variation is by comparing the metric to itself over time. This is known in manufacturing as a control chart or XmR chart. More on them in a future issue. (View Highlight)
- why did he pick those two constraints specifically?
They were both massively off target and they were both upstream. Fix them and you deliver massive improvements to the bottom line.
That’s the power of constraints! They’re leverage points in your organization that massively impact the bottom line with very small adjustments.
If not handled, they will inhibit growth. Finding them should be your top priority as a data leader or data professional and the best way to do it is by building the operating model of the business.
Ok but how did he know which one to fix first?
You will notice, if you watch the video, that Alex fixes the organizational issues first. How come? Org structure represents the biggest constraint, especially in a sales function. If your sales people aren’t managed well, no amount of effort in fixing lead quality or conversion rates will matter. (View Highlight)
- he diagram below is a very powerful visual representation of a business function or of the entire business. It’s called a Metrics Tree.
To start you need to map out the value stream. I’ve used FlyingLogic here to make this diagram, but ideally you build this using a tool that lets you make it interactive using your own data.
 (View Highlight)
- The yellow boxes represent conversion rate type metrics. The blue boxes represent absolute numbers. The product of the two feeds into the next level ultimately ending up in the revenue box. The red boxes represent “levers” or “input metrics” which are things you can manipulate to directly impact the conversion rates.
If you want to:
• Deliver more value with data
• Demonstrate the value of the data team
• Have more impact on the bottom line
• Increase personal leverage/influence at work
• Feel like the work you do is impactful / means something
you need to build a metrics tree for the business. (View Highlight)
